2018 Finances
Finances
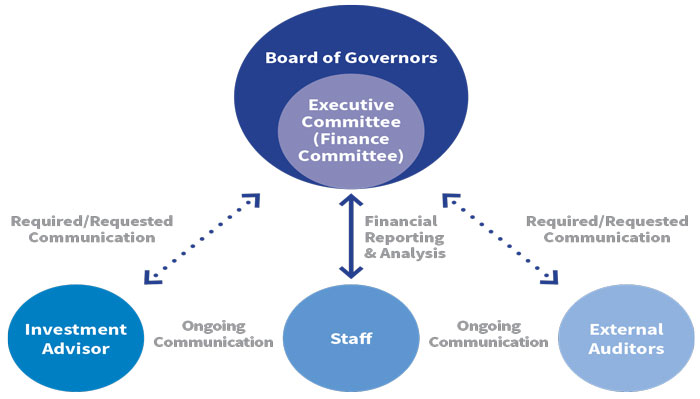
The Academy of Management’s financial performance is stewarded by our Board of Governors, with the Executive Committee directly responsible for ongoing fiscal affairs, budget, and investment oversight. The Executive Committee includes three subcommittees: a Finance Subcommittee that assists the Executive Committee in navigating through financial issues; an Audit Subcommittee that oversees the annual audit process; and an Investment Subcommittee that oversees the investment portfolio.
Throughout the year and during quarterly meetings, the Board and Executive Committee review our financial performance through detailed, quantitative, and qualitative financial reports prepared by the Academy’s Executive Director and Chief Financial Officer. In April of each year, the Board and Executive Committee review and approve the Academy’s fully audited financial statements, conducted and completed by an external auditing firm that has maintained contact with the Audit Subcommittee throughout the process. Investment advisors also periodically meet with the Executive Committee and its Investment Subcommittee to review the portfolio’s performance. Through these committees and processes, each supported by the Academy’s professional staff and external financial experts, the Academy ensures sound financial stewardship.
Our annual financial performance is the product of revenue streams and expenses. The Academy’s revenue is generated from three primary sources: membership dues, annual conference and publishing services. Expenses are functionally categorized as program and services and general administrative costs.
A key performance indicator used to monitor the Academy’s performance is operating surplus, defined as the difference between operating revenues and expenses excluding the impact of investments. Positive or net neutral operating surplus is regarded as indicative of self-sustaining operations. We have continuously been able to maintain annual operating surplus.
Our financial statements do not record extensive volunteer contributions from our members and involved universities.
OPERATING REVENUE
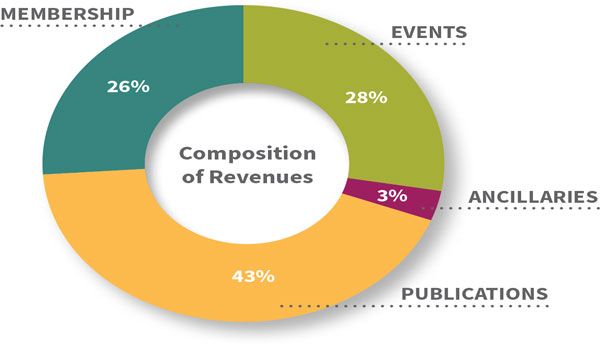
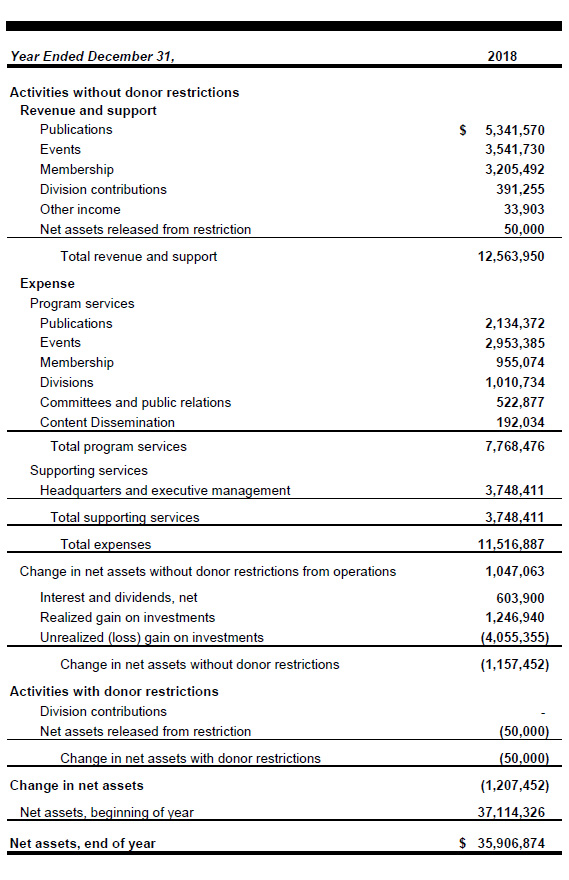
In 2018, the Academy’s operating revenue was close to $12.6 million, with membership, events (annual and specialized conferences), and publications contributing approximately 26%, 28%, and 43%, respectively. The remaining 3% of revenue (Ancillaries) is generated through sponsorships received by Divisions and Interest Groups and other services. Membership dues are based upon the number of paid members within the Academy during the fiscal year. Event revenue includes registration fees, as well as sponsorships, exhibit sales, and placement services. Publishing revenue is based upon library subscriptions, licensing arrangements, permissions, and advertising. In sum, 74% of all revenue comes from non-dues sources.
Operating revenue is impacted by changes in member counts or classes, conference registration, and changes in publishing income.
OPERATING EXPENSES
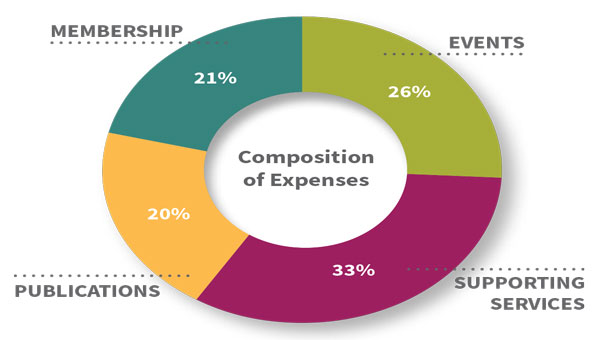
In 2018, the Academy’s operating expenses were close to $11.5 million, with programs and services (membership, publications, events) and costs for supporting services contributing approximately 67% and 33%, respectively. Operating expenses are annually impacted by conference venues and ancillary costs, publishing production and delivery, and any changes in general operating overhead. Programs and services expenses are related to the direct and indirect costs necessary to support events, as well as ongoing member and Division services, including academic program submissions support, information technology systems and platforms, direct venue expenses, member communications, and governance. Supporting services typically include staff, employee benefits, rental space, and other indirect costs, such as required external advisory services and insurance.
INVESTMENTS AND RESERVES
Our investment portfolio is governed by an Investment Policy Statement, adopted by the Board of Governors in 2016 and reviewed annually. This policy specifies the Academy’s investment risk profile, asset allocation parameters, and appropriate market benchmarks to measure and assess performance. The purpose of investments is to fund AOM’s strategic initiatives and to provide financial stability in a changing organizational landscape that affects the non-dues revenue sources upon which we rely. Use of investments is determined by the Board of Governors. Overall, our investment mix is moderate when compared to like organizations and includes, but is not limited to, holdings in equity and fixed income, and select alternative investments. Investment portfolio return fluctuates with prevailing global macroeconomic and market trends.
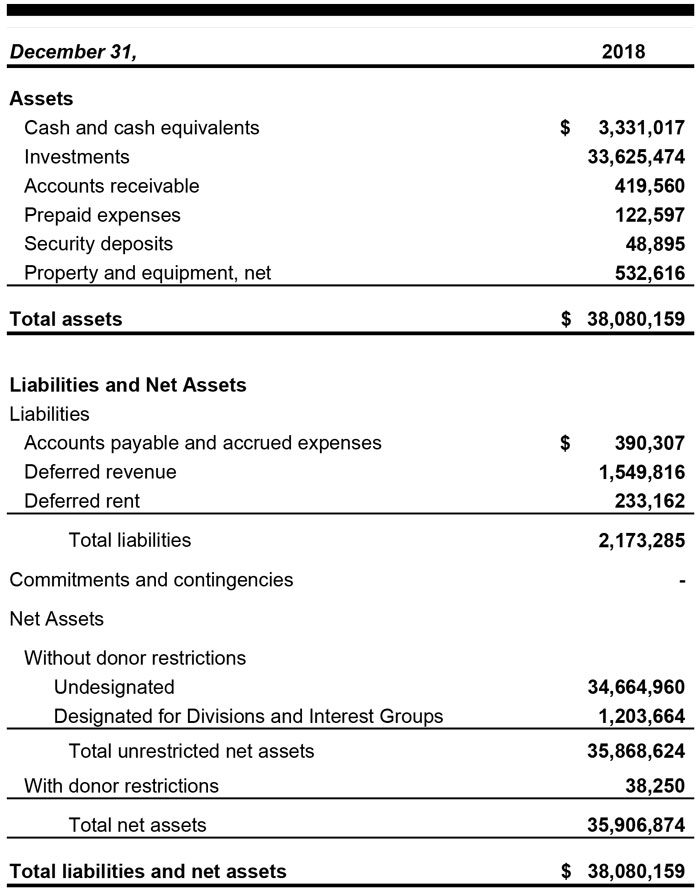
STATEMENT OF FINANCIAL POSITION
STATEMENT OF ACTIVITIES
UNAUDITED FINANCIAL STATEMENT, first six months of 2019
Year to Date June 30th
Revenue & Support
Publications
Events
Membership
Division Contributions
Other Income
$2,544,709
$8,700
$1,615,283
$252,575
$0
Expense
Program services
Publications
Events
Membership
Division
Committees
Content Dissemination
$1,083,349
$431,253
$651,117
$98,541
$77,622
Total program services
Supporting services
Headquarters and executive management
$2,243,028
Total supporting services
Total expenses
Change in net assets from operations
Interest and dividends
Realized gain on investments
Unrealized (loss) gain on investments
-$163,643
$369,987
$441,248
$3,372,518
Change in net assets
Net assets, beginning of year
$4,020,110
$35,906,874
Net assets, June 30th